The Billion-Dollar Founder Study: What 20 Years of Exits Actually Say About Founding Teams Behind the Biggest Companies

What do the founding teams of billion-dollar technology companies actually have in common? Everyone has opinions. No one has built a real dataset to answer it. So we did.
We put together a dataset of every U.S. tech company that either went public or was acquired for more than $1 billion in the past 20 years, inflation-adjusted (see methodology).
What we found is different. Familiarity between co-founders is overrated. Pedigree isn’t destiny. And the single biggest edge isn’t brilliance — it’s compounding.
The real founding story — who actually started the company, how the founders met, what each person’s role was on day one — is rarely written about (or summarized by AI) accurately. That meant manually reviewing more than 2,000 LinkedIn profiles, listening to podcast interviews, watching old conference talks, digging through blog posts, and piecing together founding stories that were often scattered across the internet.
For each company, we tried to reconstruct the formation of the team from scratch.
How many founders were there?
Did they know each other before starting?
Had they worked together?
Gone to school together?
How old were they at founding?
Did the CEO have prior startup experience?
What school did the founders go to?
We were trying to answer a narrower question: what patterns actually show up in venture-scale companies that make it all the way to a large exit?
Startup mythology tells us great companies are born from chemistry — college roommates, former coworkers, best friends who “just get each other.” It tells us pedigree matters. That youth is an advantage. That brilliance is individual.
The numbers tell a different story.
Teams Outperform Solo Founders in Top Exits
When looking at the companies that exited at $1B+, 82% were founded by two or more co-founders. Two founders is the most common structure. Three-founder teams are also well represented.
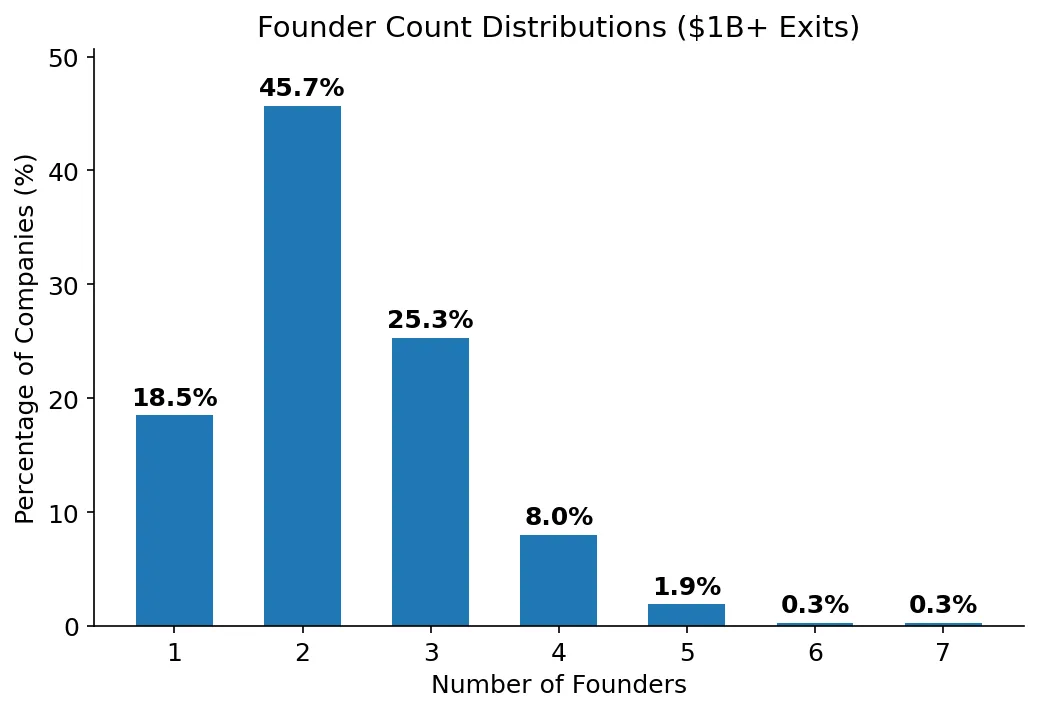
So yes, solo founders show up. Roughly one in five billion-dollar exits was started by a single person.
Peter Walker’s data at Carta shows that solo founding has exploded at the formation stage — rising from 18% of new startups in 2016 to 36% in 2025, accelerating sharply after the launch of ChatGPT. Solo founders are starting more companies than ever.
But when you isolate the very largest exits, solo founders almost disappear.
Out of the top 5% of exits – 16 companies ranging from $24B to $98B in exit value, only 1 was led by a solo founder.
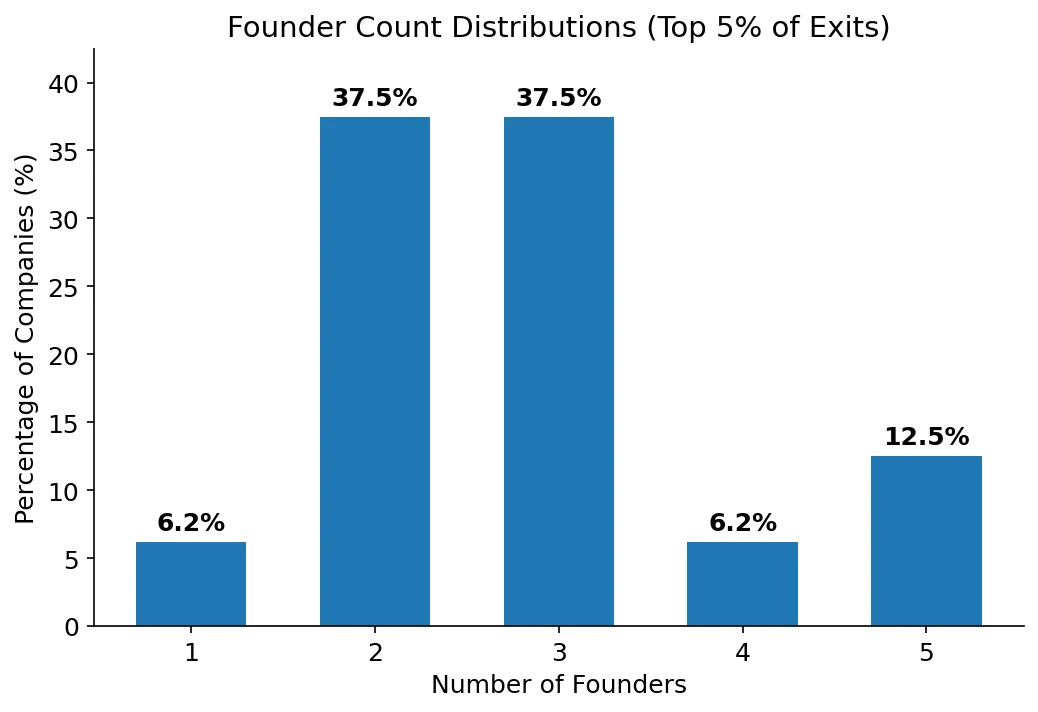
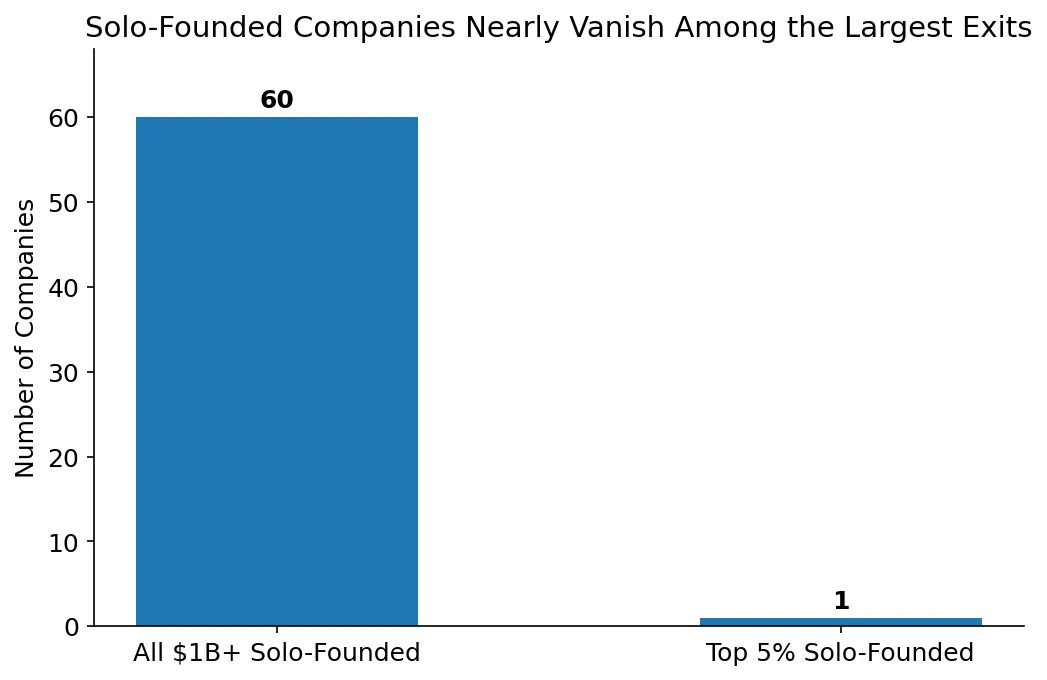
Solo founders can absolutely build valuable companies. But the largest exits overwhelmingly come from teams.
The constraint isn’t starting. It’s sustaining. The companies took a median of roughly 12 years to reach liquidity. Over that time, complexity compounds. Markets shift. Teams scale. Pressure increases.
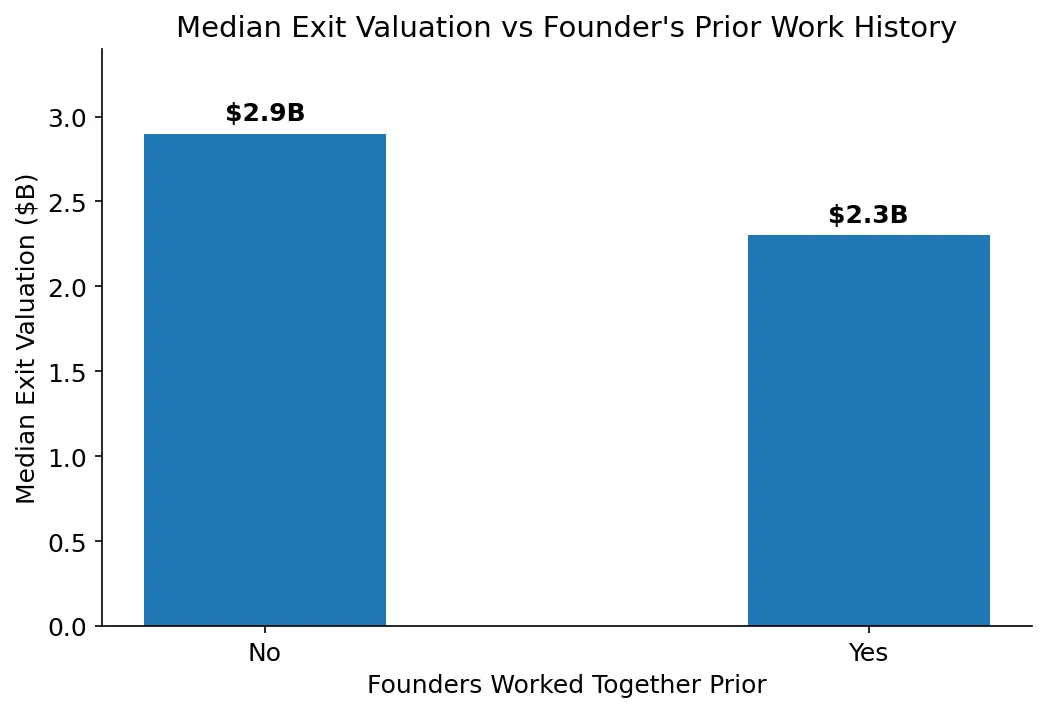
Working Together Before Doesn’t Make the Exit Bigger
One of the most persistent beliefs in choosing a co-founder is that history de-risks the partnership. Former coworkers. College roommates.
The story feels safe: we already trust each other.
But longer relationship histories don’t translate into larger exits in the data. When founders had worked together before, the median exit valuation was $2.3B, lower than the $2.9B median for those who had not. That’s a 21% gap in median exit valuation.
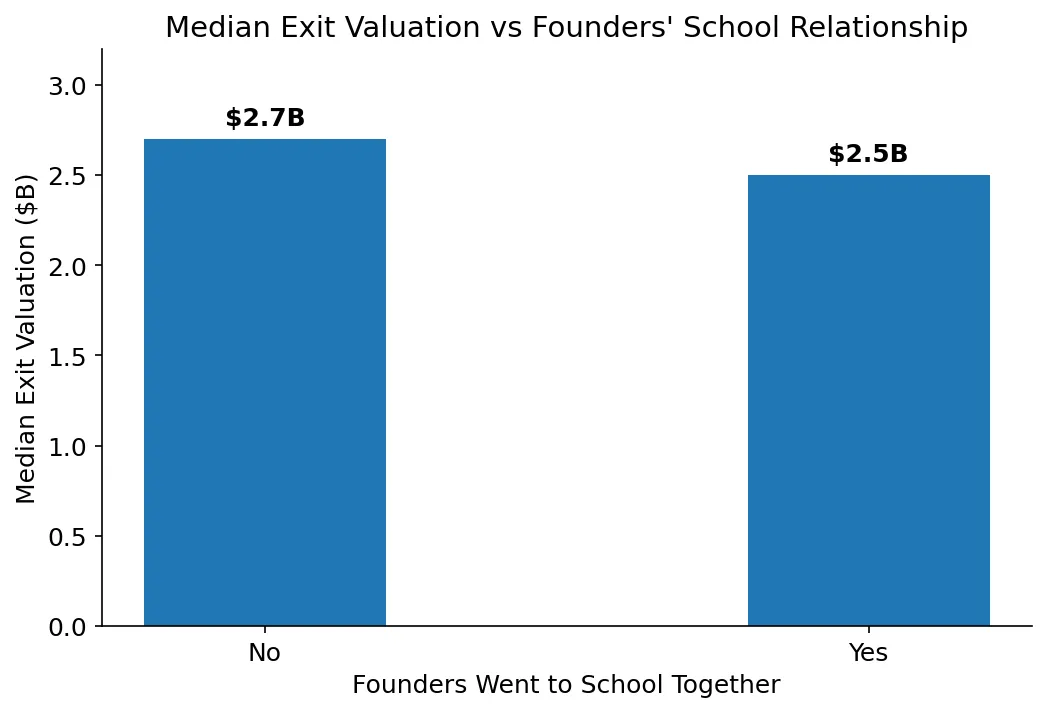
And the pattern repeats with school ties. Founders who went to school together show a lower median valuation ($2.5B) than those who did not ($2.7B).
This doesn’t mean prior relationships are bad but it does strongly suggest that they are not the edge people so often assume. Shared history reduces friction early, but scale is not won in the first six months.
The best co-founder isn’t the most convenient one. It’s the most complementary one.
The Biggest Edge is Startup Experience (and Past Success)
Prior startup experience, especially for the CEO, is one of the clearest signals associated with larger exits.
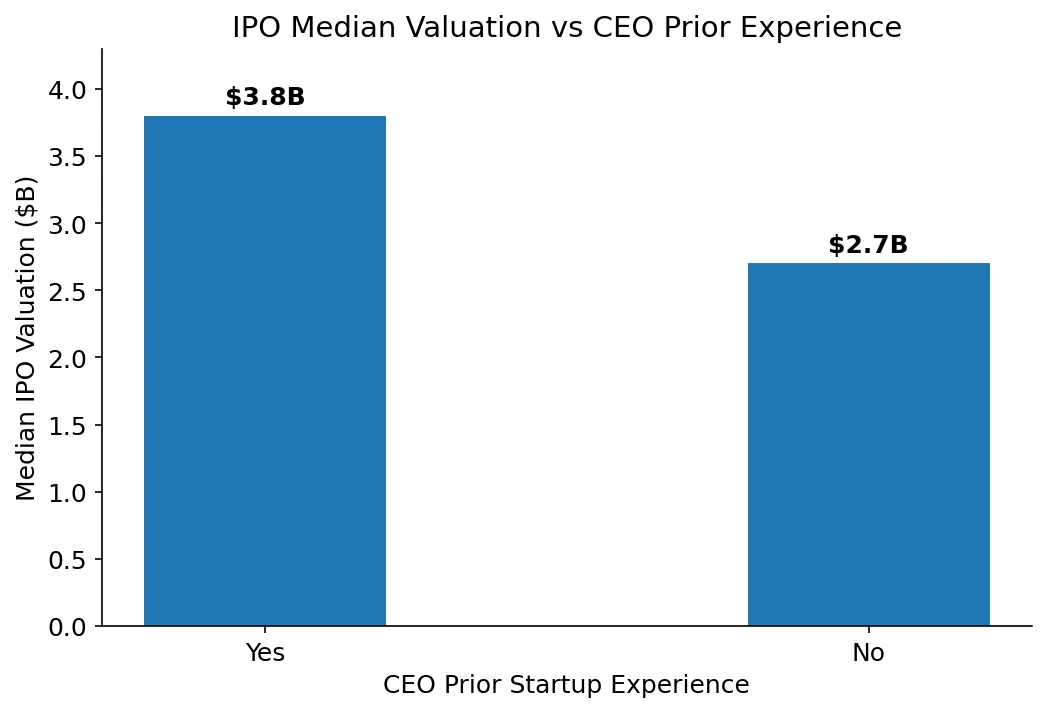
Among IPO companies in particular, CEOs with prior startup experience had a median valuation of $3.8B compared to $2.7B for those without - a 41% premium.
When the lens expands from the CEO to the founding team, the signal gets stronger.
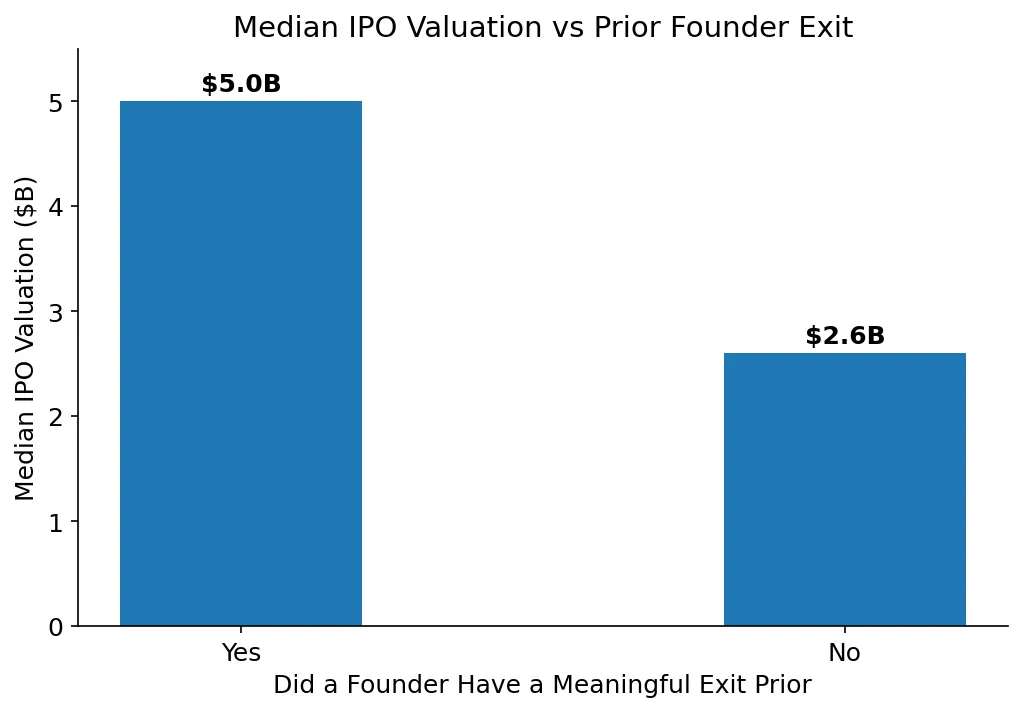
Among IPO outcomes in the dataset, teams where at least one founder had previously built and exited a company had a median IPO valuation of $5B - nearly double the $2.6B for teams with no prior exits.
Why? Scaling a company is a learned skill. Hiring velocity, governance, capital markets, board dynamics — founders who’ve done it before recognize the patterns faster. Prior exits also create personal liquidity. When founders aren’t financially pressured, they can take bigger swings and optimize for building long-lasting companies rather than making safer decisions that lead to smaller outcomes.
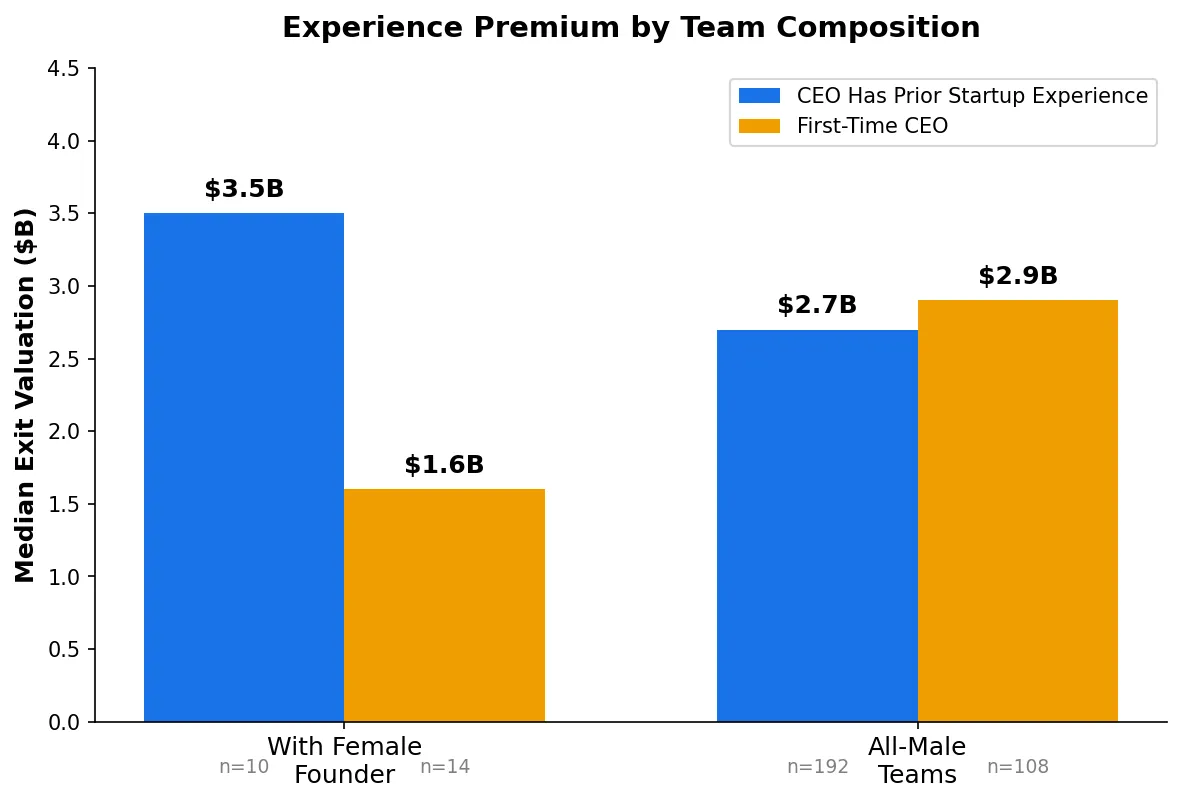
The experience signal holds across team composition. 7% of billion-dollar exits in our dataset included a female founder. Teams with an experienced female CEO had a median exit of $3.5B. vs first-time female CEOs with $1.6B. The gap was even wider than in all-male teams.
The sample is small, so we’d stop short of drawing broad conclusions about gender. But the fact that the experience premium appears regardless of team composition suggests it’s one of the more robust patterns in the data.
Building Big Takes More than a Decade
Across all billion-dollar exits in the dataset, founding CEOs stayed in the role for roughly 12 years. Founding CTOs stayed about 11 years.
In M&A exits, tenure is similar, where founding CEOs stay closer to 12 years, and CTOs slightly less than that. Acquisitions tend to happen earlier, and leadership transitions are more common before exit.
In the top 5% of exits, tenure stretches longer. Founding CEOs stay roughly 15+ years, with CTOs just behind them.
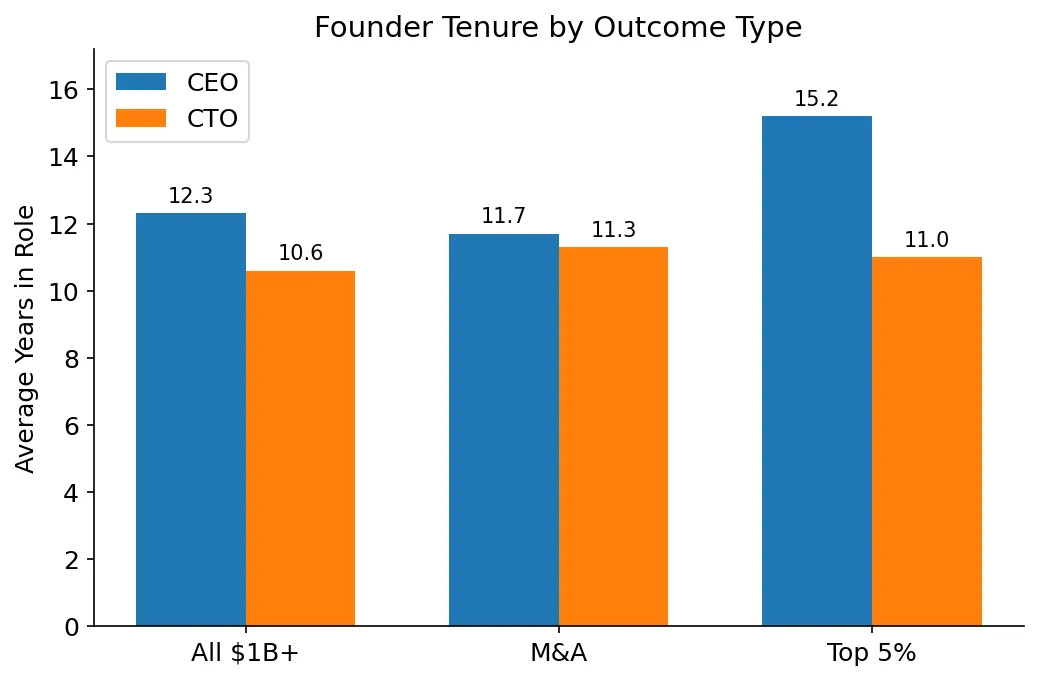
The trend is clear:
M&A exits: founding CEOs stay about 12 years, CTOs about 11.
All $1B+ exits: CEOs stay 12.3 years, CTOs 10.6.
Top 5% exits: CEOs stay 15+ years, CTOs 11.
Over ten to twelve years, companies scale from dozens of employees to hundreds or thousands. They move through multiple product generations. They survive capital cycles and competitive waves that didn’t exist at founding.
If the median path to a billion-dollar exit is more than a decade, and the largest exits take even longer, you are not choosing someone to survive the launch.
You are choosing someone to build with through reinvention.
Billion-Dollar Founders are 35 years old. But Timing Matters More.
Startup culture celebrates youth. The numbers tell a different story.
Across billion-dollar exits, the median age at founding for the primary founder is 35. These founders are old enough to have accumulated real experience, but young enough to take risks and endure a decade-long build.
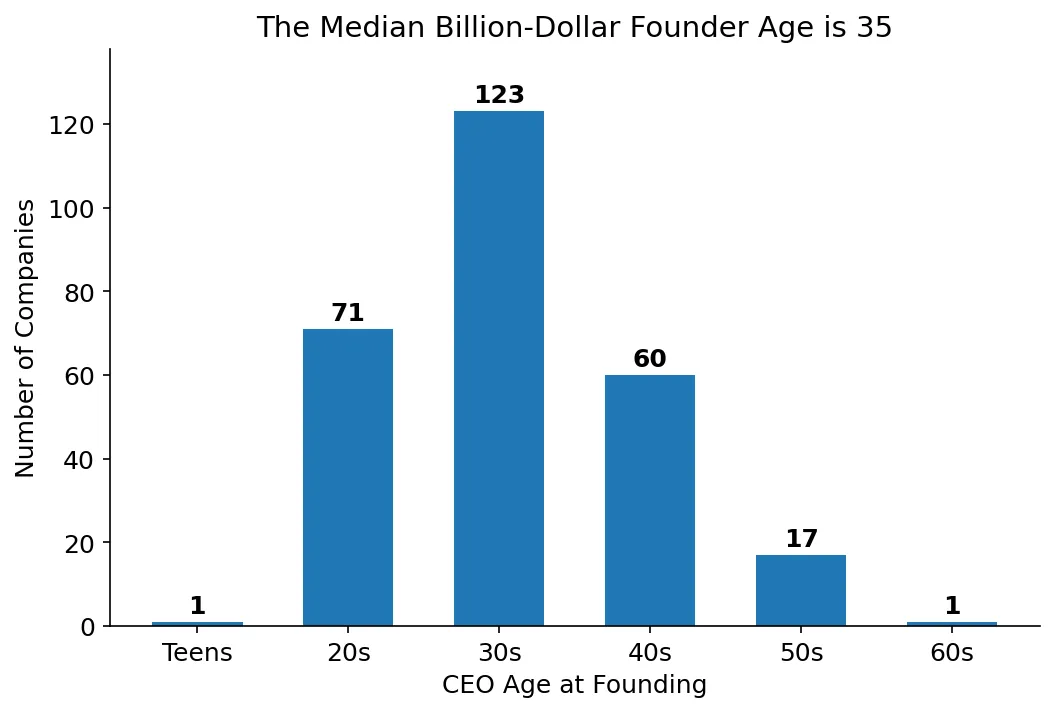
Others have found the same thing Ali Tamaseb’s analysis of 30,000 data points on billion-dollar startups found a median founder age of 34. Aileen Lee found it the same when she coined the term “unicorn” in 2013 and again when she revisited the data a decade later. Mid-30s appears to be one of the most stable patterns in venture-scale outcomes.
But the more interesting signal isn’t age in isolation, it’s when they were born.
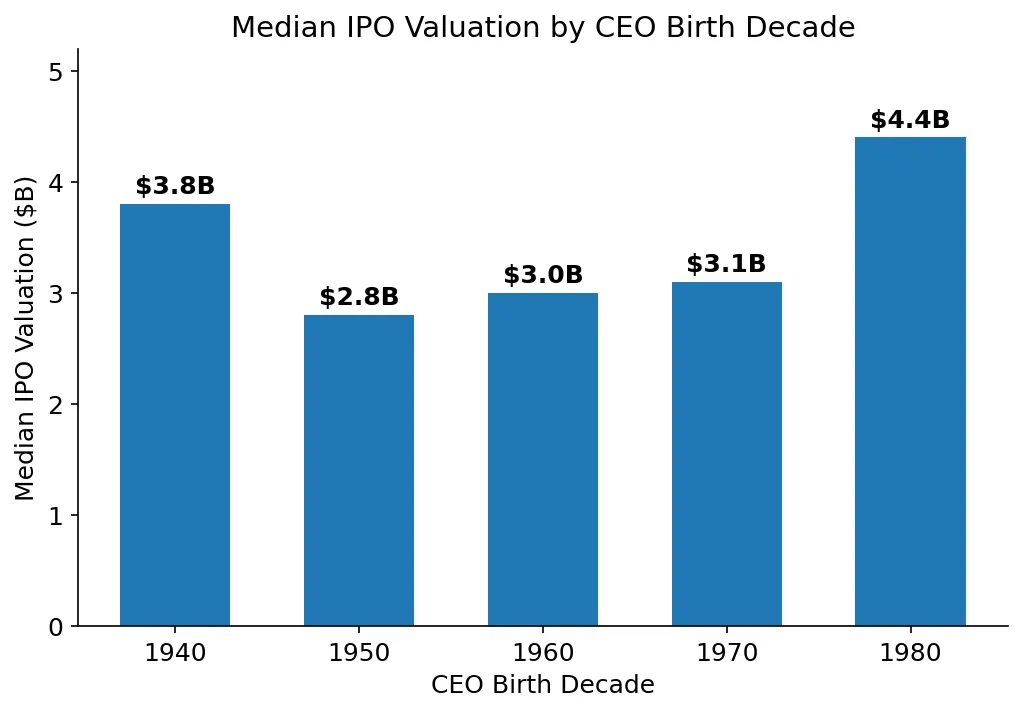
When you look at IPO exits by CEO birth decade, founders born in the 1980s show up much more in the largest IPO-scale exits.
Our data suggests something different: it’s not that founders are aging into success — it’s that each generation of builders hits their prime during a different platform shift.
That cohort grew up alongside personal computing, entered adulthood during the rise of the internet, and reached prime founding age during mobile and cloud. They were timed, not just talented.
The biggest exits don’t track to age. They track to when a founder hit their prime relative to a major platform shift.
Which raises a natural question…
The AI Generation: Founders Born in the 1990s
If the 1980s cohort rode cloud and mobile to much more larger IPO exits at the top of the distribution, what happens to the cohort reaching prime founding age during AI?
To explore that question, we expanded the dataset slightly. In addition to IPOs and acquisitions, we looked at the top 20 most valuable private companies in the U.S. today and incorporated their current valuations as a proxy for eventual IPO outcomes. These companies were largely built during the rise of AI and modern cloud infrastructure.
When those companies are added to the analysis, founders born in the 1990s show a sharp jump in median valuation.
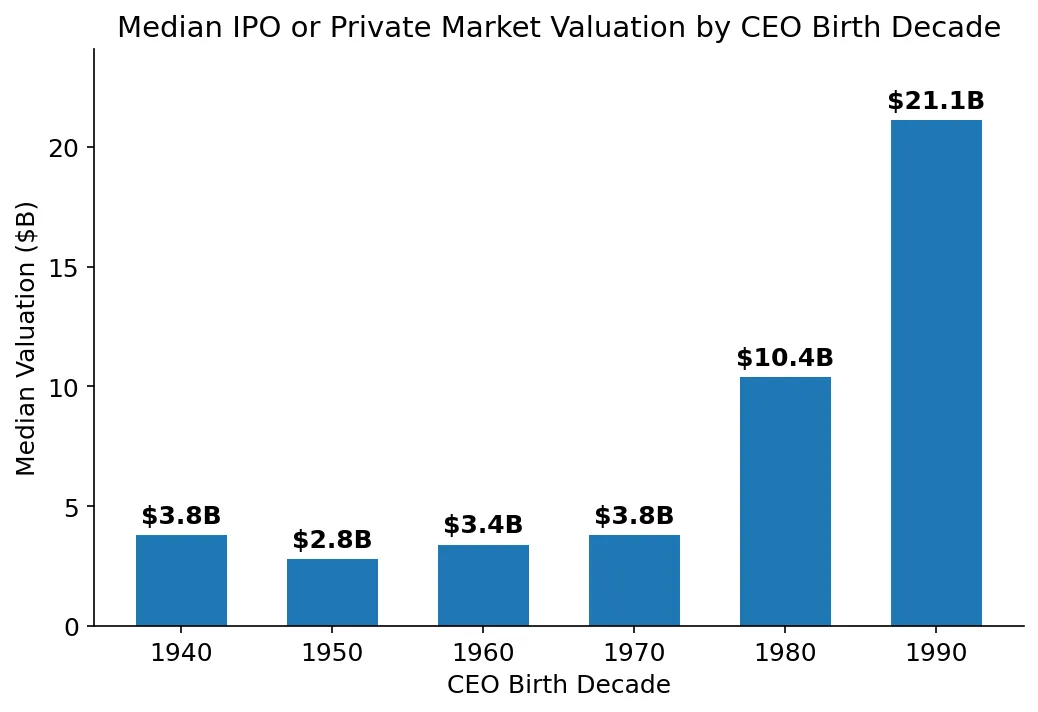
The sample size is still small, so it would be premature to draw hard conclusions. But the signal is directionally consistent with what the earlier cohorts show. Notably, there is only one private company in the dataset with a CEO born in the 2000s, AnySphere (makers of Cursor). We excluded this data point because median values were only calculated for decades with at least three companies.
Platform shifts produce new generations of outsized founders. The 1980s cohort rode mobile and cloud. The early signal suggests the 1990s cohort will ride AI.
Elite Schools Produce Founders. Not Bigger Exits.
Certain institutions appear frequently among billion-dollar CEOs.
Stanford leads. University of California, Berkeley and IIT (various) follow. MIT, BYU, Michigan, and others show up repeatedly.
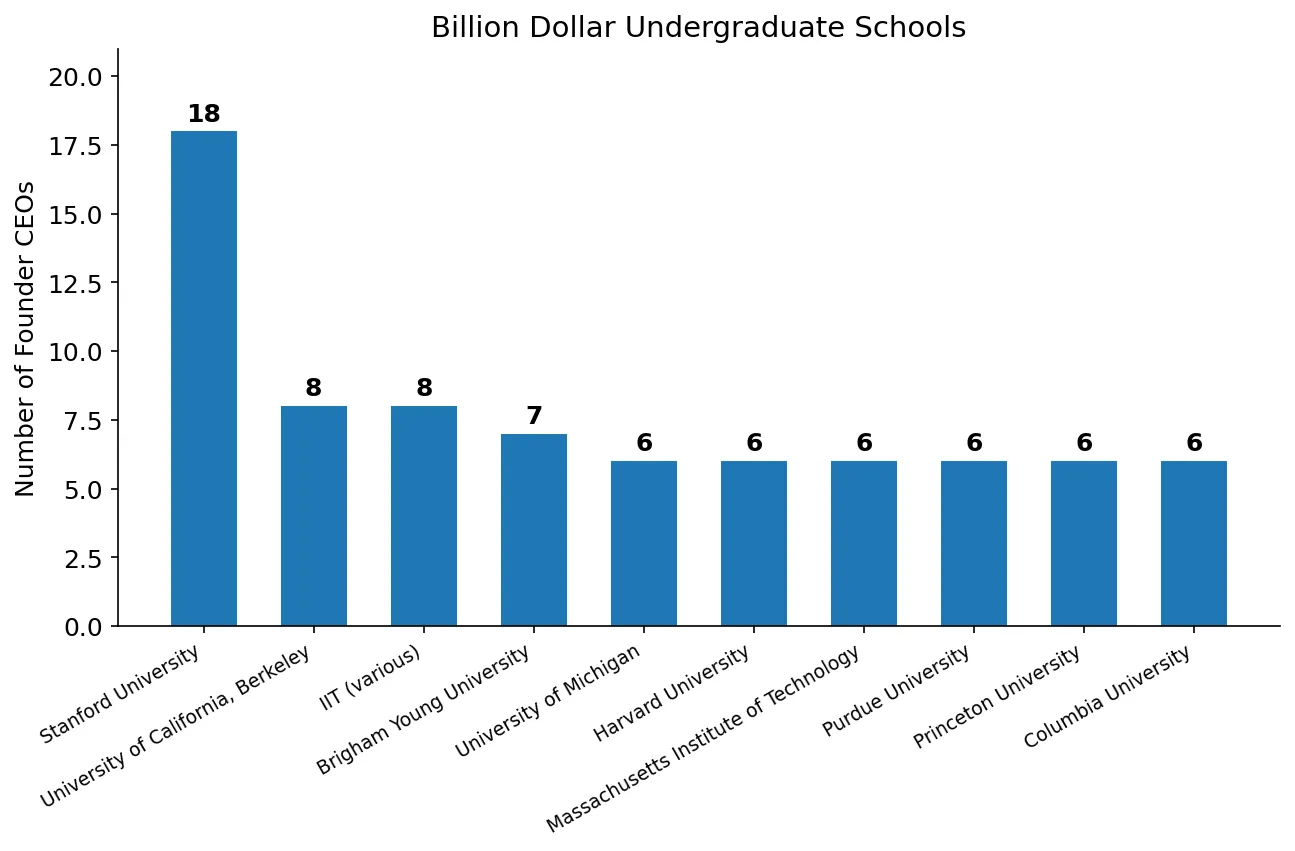
Stanford clearly over-indexes in raw founder count. That is not surprising given their proximity to Silicon Valley, density of venture capital, and peer networks.
Ilya Strebulaev’s research on over 3,200 unicorn founders, finds a similar concentration at the top — with Harvard, Stanford, and Wharton produce the most unicorn founders by raw count.
But raw count is only half the story. When isolating the Top 5% of exits by valuation, Stanford shows up two times in the Top 5%. But many elite institutions do not appear at all.
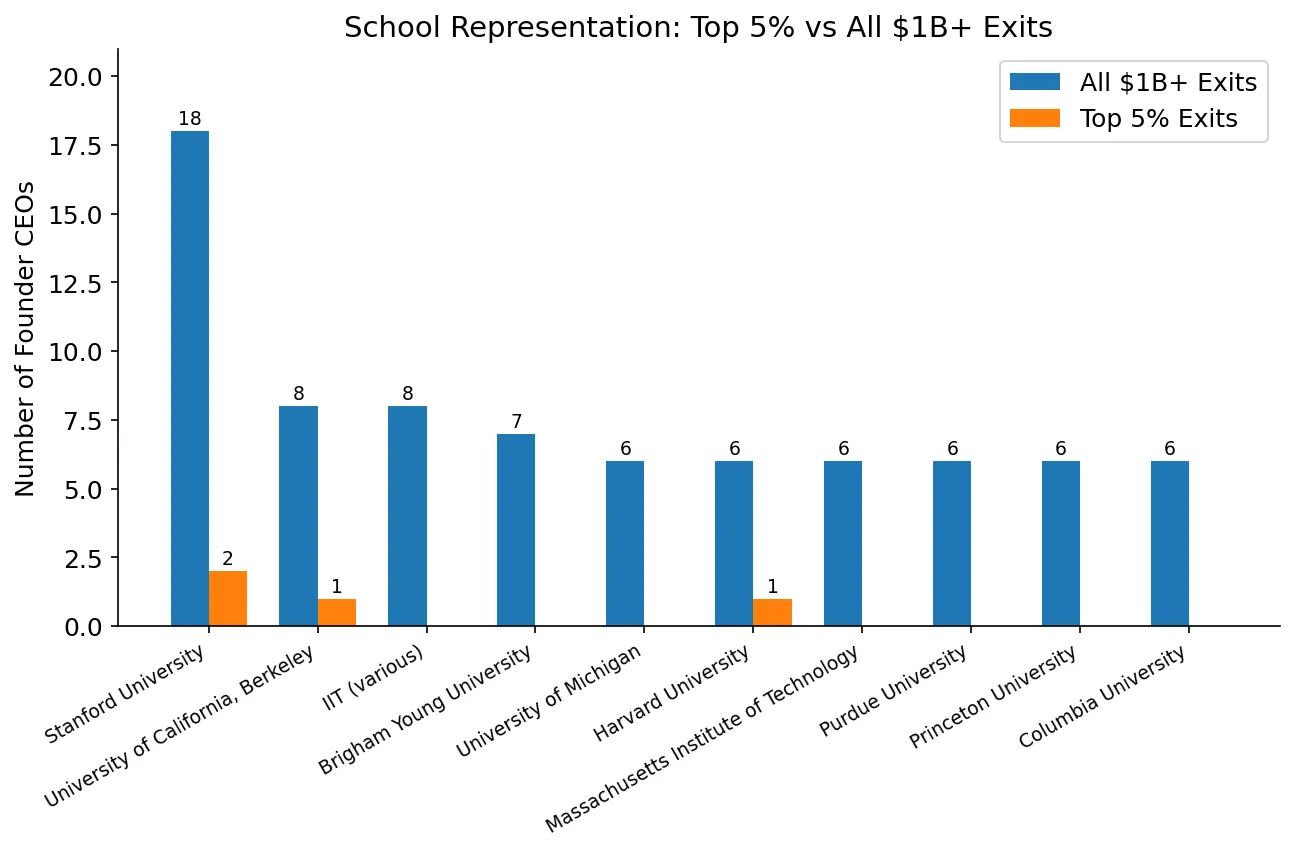
Mild concentration, no monopoly.
So does pedigree actually predict exit size?
Founders from the five most represented schools have a median exit valuation of $2.6B. And founders from every other school? Also $2.6B.
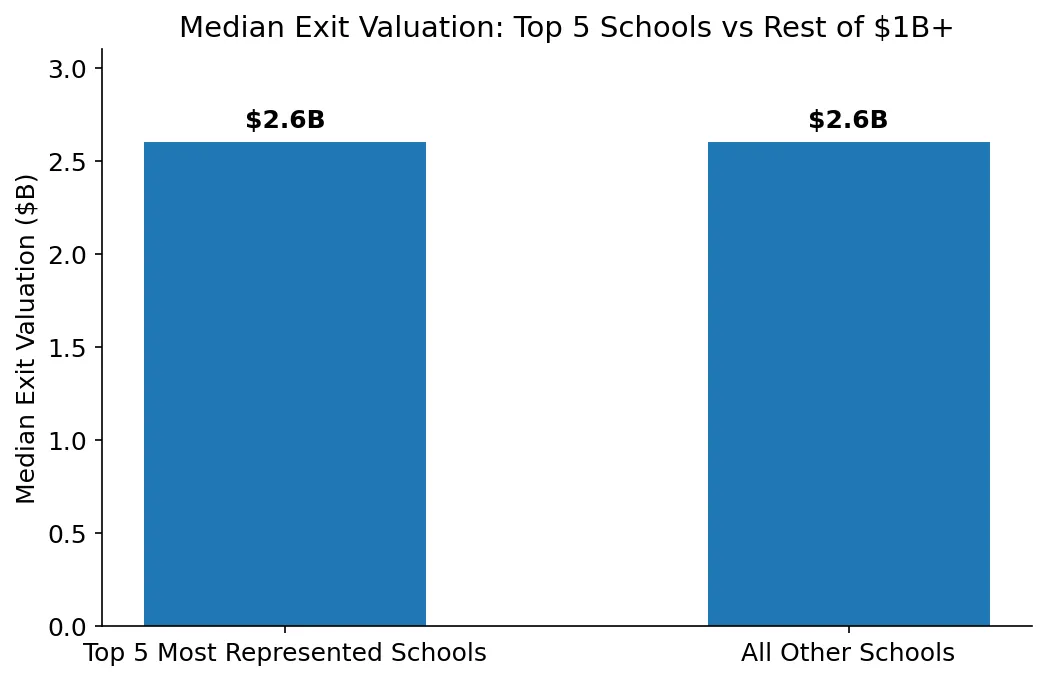
Elite schools are clearly overrepresented in founder counts. They increase exposure and access. But prestige does not determine the size of the exit. The ceiling is set elsewhere — by market timing, team structure, endurance, and how long you can keep building.
Solo Founders Take Longer
One assumption about multi-founder teams is that coordination slows them down. More opinions. More conflict. More complexity.
It’s the opposite. Solo founders take the longest to reach liquidity.
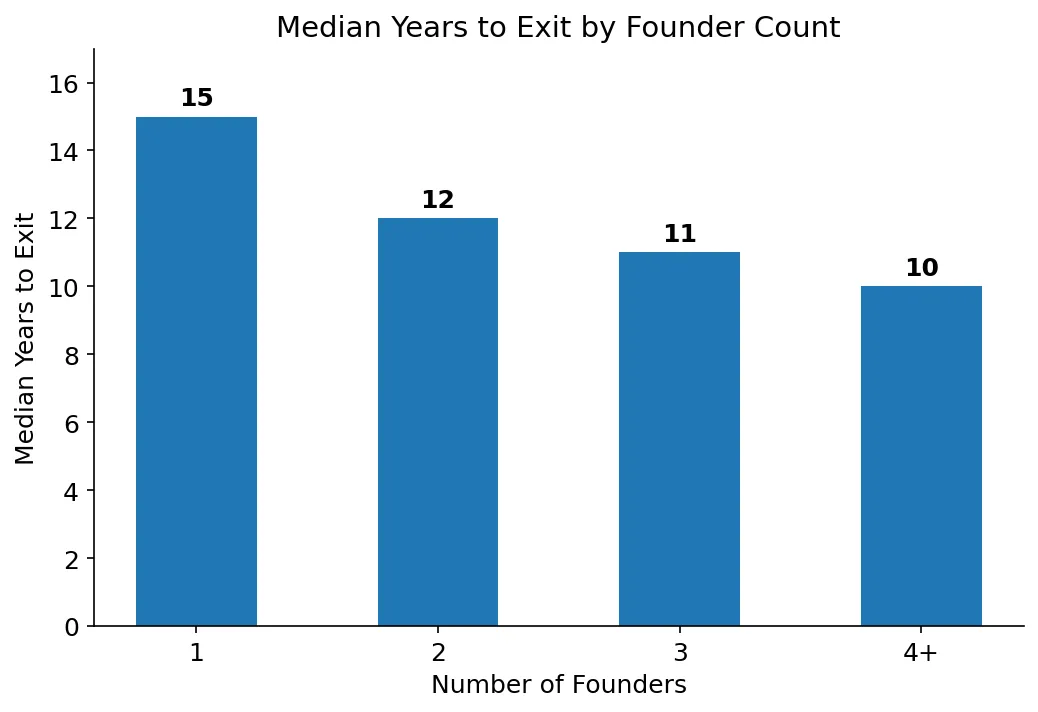
This is not a small gap. Solo-founded companies take roughly 3 years longer, on median, to reach a liquidity event.
Multi-founder teams don’t slow companies down. If anything, they compress the timeline.
Layer this onto earlier findings and the pattern becomes clearer. Solo founders are less common among billion-dollar exits, they nearly disappear in the top 5%, and they take longer to get there.
You Don’t Need a CS Degree, But it May Help
There’s a long-running debate about whether companies need a technical founder in the CEO seat to build something large.
Across all $1B+ exits, it’s close to an even split: 47% technical versus 53% non-technical. But when isolating the top 5% of exits, the gap widens in favor of technical CEOs (56% vs 44%).
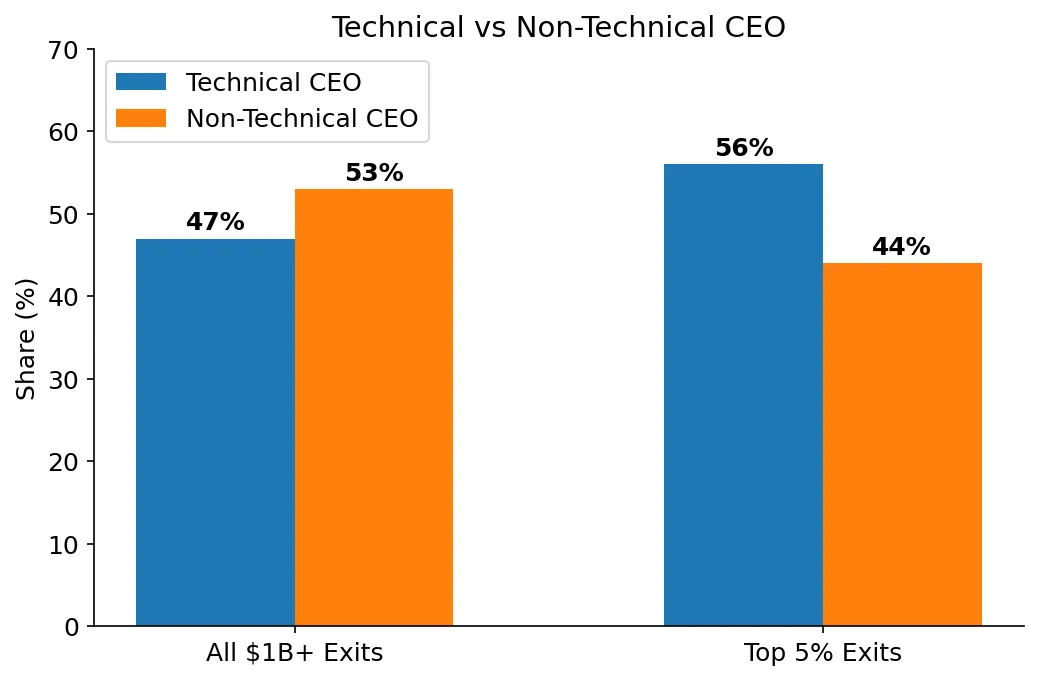
Note: the chart above includes founders whose undergraduate degree is unknown or who dropped out, classified as non-technical. This is a conservative framing.
When excluding the 66 founders whose degree information is unavailable or who dropped out before completing a degree, the picture shifts notably. Among founders with known undergraduate backgrounds, 59% hold technical degrees versus 41% non-technical.
The skew gets more pronounced at the top. Among the Top 5% of exits (excluding 4 with unknown degrees), 75% of founding CEOs have a technical background versus 25% non-technical.
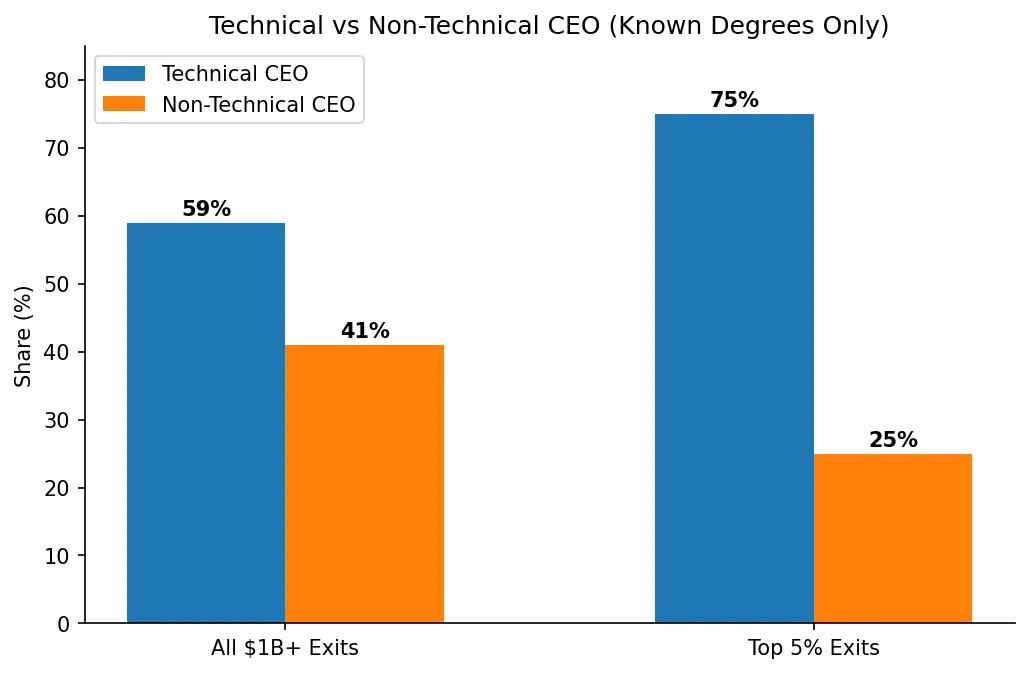
Either way, the story is the same: technical founders are well-represented at the billion-dollar level, and their share grows as exit size increases. The question is whether the baseline is roughly even (conservative estimate) or already tilted technical (when limiting to known degrees). Either way, non-technical founders remain a substantial share of billion-dollar exits.
Family Founders Are Extremely Rare
Startup lore loves the story of family founders. Brothers starting a company in a garage. Married couples building something together.
In practice, this almost never happens at venture scale.
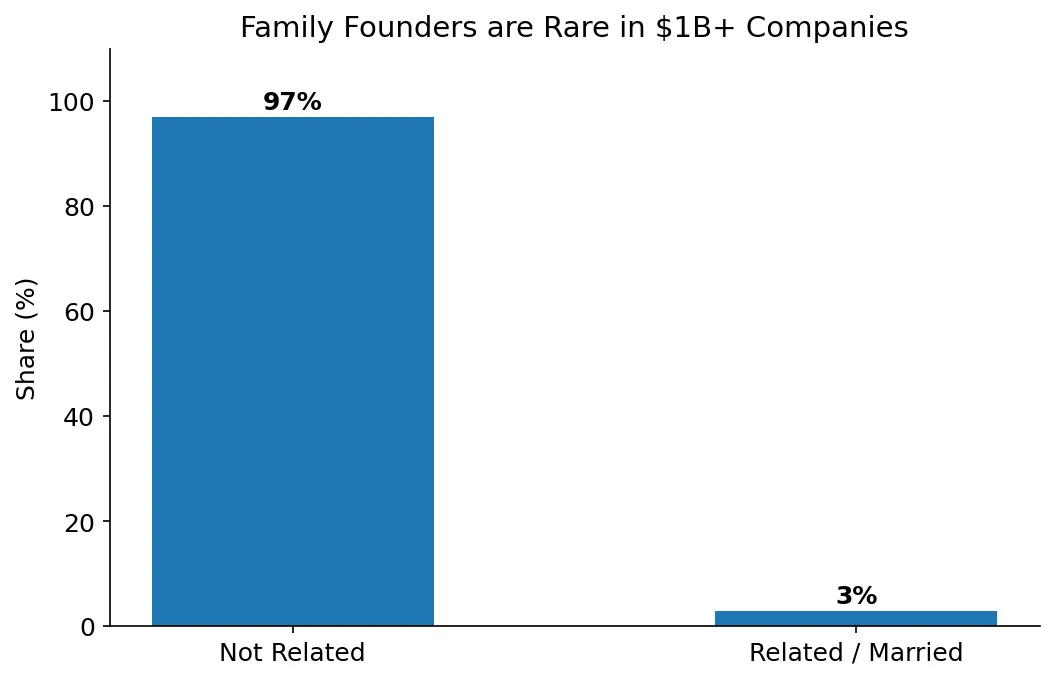
Only 3% of companies in the dataset were founded by people who were related or married. The rest, roughly 97%, were built by founders with no family relationship.
Trust clearly matters when starting a company. But that trust usually doesn’t come from family ties.
The Most Common Billion-Dollar Founder Name Is… David
One of the fun things that falls out of a large dataset is the occasional pattern that almost certainly means nothing.
Founder first names are one of those.
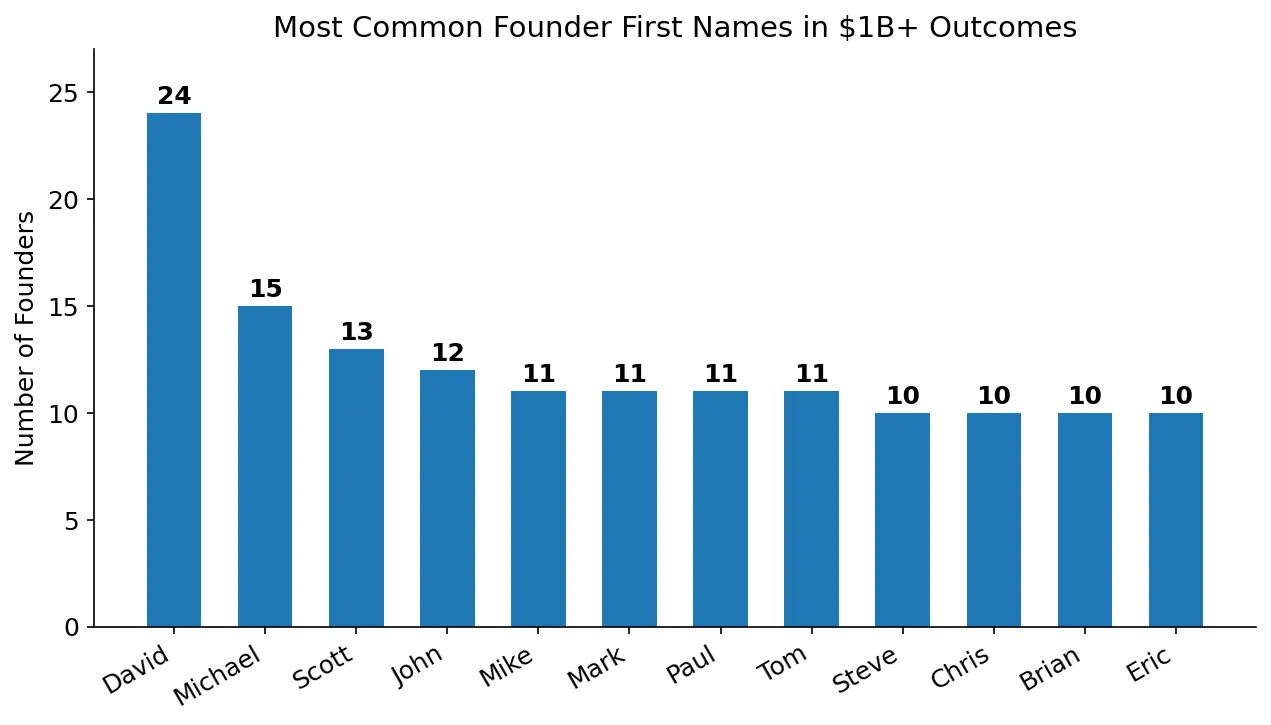
So if your name is David, your odds of building a billion-dollar company appear unusually high, followed by familiar staples like Michael, Scott, and John.
Your name is not a growth strategy.
More likely, it simply reflects the demographics of the founder population. Many founders in this dataset were born in the 1960s through 1980s, when a relatively small set of names dominated in the United States.
In other words, the startup ecosystem may be wildly innovative, but the names of the people building it are surprisingly conventional.
What Actually Predicts Scale is the Right Team at the Right Time
Startup lore likes simple explanations: the brilliant solo founder, the college roommates who always knew they would build something together, or the prodigy who drops out and changes the world.
But when we look at the companies that actually make it to large exits, the pattern is more grounded. The most successful companies are usually built by small teams, led by founders who accumulate experience over a decade of building and whose timing aligns with major technology shifts.
What doesn’t matter – despite how much people assume it does: shared history. Founders who worked together before produced lower median exit valuations. Founders who went to school together didn’t have the edge, despite what many would assume.
The best co-founder isn’t the most convenient one. It’s the most complementary one.
Billion-dollar outcomes come from structure and timing: the right founding team, the endurance to build for ten or more years, and the good fortune to start a company as a new platform wave begins.
If the earlier patterns hold, the next generation of outsized companies will likely follow the same formula. The difference is that the founders building them will increasingly be those who came of age alongside AI.
Methodology
To build this dataset, we started with two primary sources for identifying liquidity events. For IPOs, we used the publicly available data compiled by Professor Jay Ritter at the University of Florida, which tracks U.S. IPO activity over time. For acquisitions, we relied primarily on PitchBook transaction data to identify venture-backed companies acquired for $1B or more.
From there, we applied a series of filters to construct a consistent universe of venture-backed technology companies. The companies had to be founded in the United States, have a liquidity event between 2006 and 2025, and fall broadly within the technology sector. This includes categories such as consumer software, enterprise software, fintech, defense technology, hardtech, semiconductors, crypto, media, and telecom. We excluded sectors with very different venture dynamics, such as biotechnology, pharmaceuticals, consumer packaged goods, and traditional consumer brands.
We also filtered out transactions that did not represent venture-style startup outcomes, including leveraged buyouts, private equity rollups, and companies that were already public but later taken private. For IPOs, we included traditional offerings as well as direct listings and SPAC mergers to capture the full range of modern public market entry paths.
For acquisitions, we used announced deal values combining both cash and equity consideration where available in order to approximate total transaction value.
All valuations were converted into 2025 dollars to allow comparisons across time. Rather than applying year-by-year CPI adjustments, we normalized earlier exits using the average U.S. inflation rate over the past twenty years (2.6% annually).
After applying these constraints, the dataset included just over 344 U.S. venture-backed companies that exited at $1B or greater.
Most of the founder-level data was assembled manually by reviewing LinkedIn profiles, podcast interviews, SEC filings, and historical articles to reconstruct how founding teams formed and what prior experience they had. While imperfect, this process allowed us to capture founder relationships and backgrounds that rarely appear in structured datasets.